Title
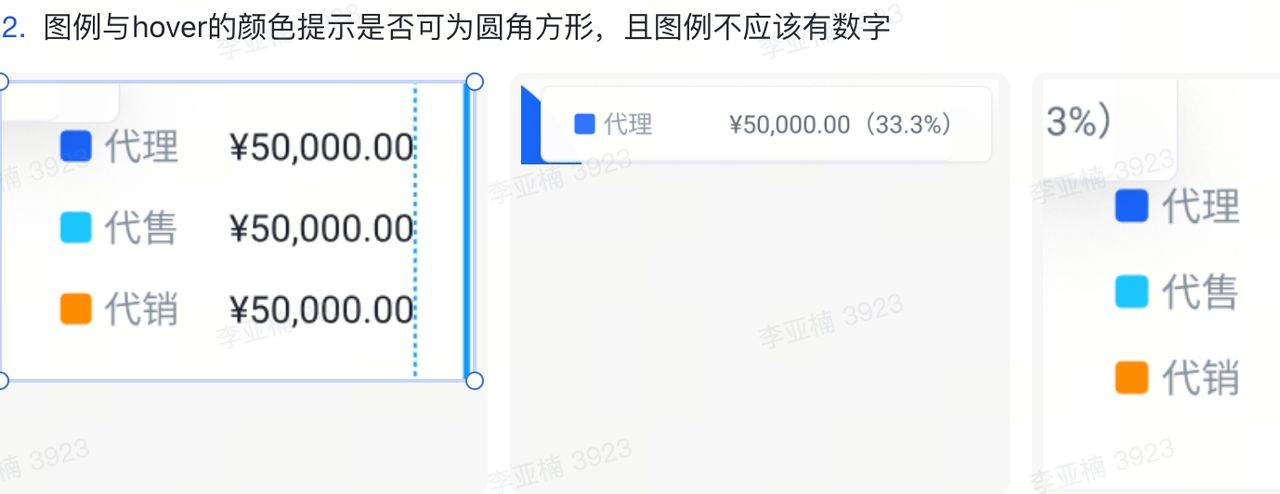
How to configure Legend Shape as a rectangle with rounded corners?
Description
As shown below:

Solution
Support configuration as'rectRound 'type
- Tooltip:
shapeType:"rectRound"
tooltip: {
    mark: {
      content: [
        {
          shapeType: 'rectRound',
          key: datum => datum['type'],
          value: datum => datum['value'] + '%'
        }
      ]
    }
  }</br>
- Legend:
legends: {
    visible: true,
    orient: 'right',

    item: {
      width: '15%',
      shape: {
        style: {
          symbolType: 'rectRound'
        }
      }
    }
  },</br>
Code Example
const spec = {
  type: 'pie',
  data: [
    {
      id: 'pie',
      values: [
  { value: 10, category: 'One' },
  { value: 9, category: 'Two' },
  { value: 6, category: 'Three' },
  { value: 5, category: 'Four' },
  { value: 4, category: 'Five' },
  { value: 3, category: 'Six' },
  { value: 1, category: 'Seven' }
]
    }
  ],
  categoryField: 'category',
  valueField: 'value',
  legends: {
    visible: true,
    orient: 'right',

    item: {
      width: '15%',
      shape: {
        style: {
          symbolType: 'rectRound'
        }
      }
    }
  },
  tooltip: {
    mark: {
      content: [
        {
          shapeType: 'rectRound',
          key: datum => datum['type'],
          value: datum => datum['value'] + '%'
        }
      ]
    }
  }
};

const vchart = new VChart(spec, { dom: CONTAINER_ID });

vchart.renderSync();

// Just for the convenience of console debugging, DO NOT COPY!
window['vchart'] = vchart;</br>
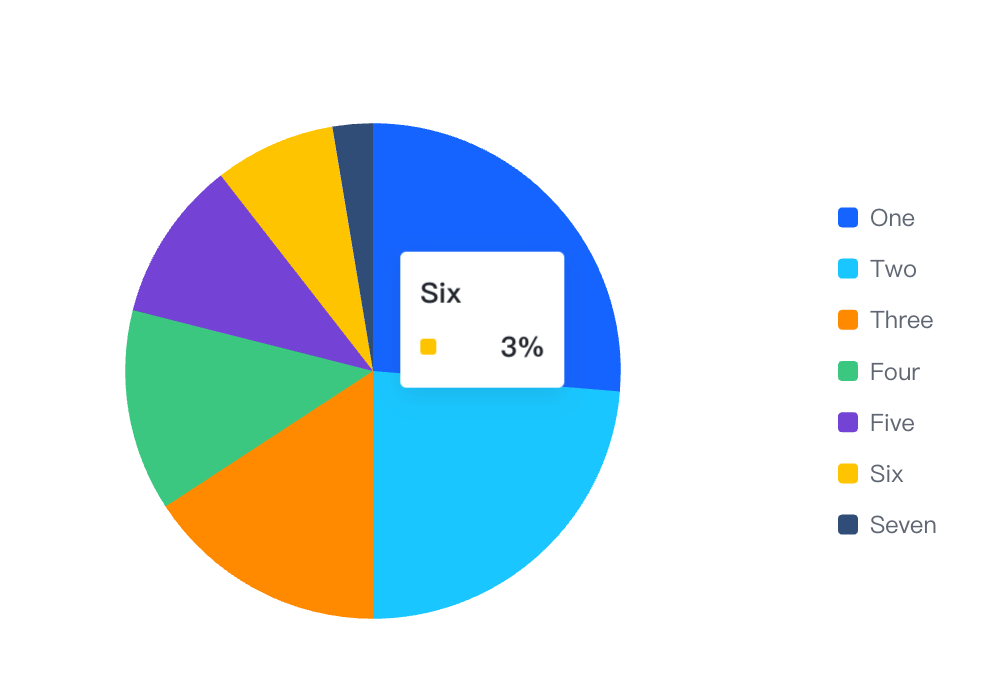
Result

Related Documents
- Tutorials: https://visactor.io/vchart/guide/tutorial_docs/Chart_Concepts/Legend , https://visactor.io/vchart/guide/tutorial_docs/Chart_Concepts/Tooltip
- API:https://visactor.bytedance.net/vchart/option/barChart#tooltip.dimension.content,https://visactor.bytedance.net/vchart/option/barChart-legends-discrete#item.shape.style.symbolType
- Github:https://github.com/VisActor/VChart/
